Written by: Arjun Karnik, Growth Marketing Specialist
Key Takeaways
- B2B marketing attribution models assign pipeline and revenue credit across multi-stakeholder buying journeys. The model you choose determines which channels receive credit for closed deals.
- Single-touch models such as first-touch and last-touch are simple and fast to read. Multi-touch models distribute credit across multiple interactions and reveal more of the journey.
- Account-level attribution is essential for committee-driven deals because it rolls up every touchpoint from every stakeholder instead of crediting only the person who filled out the form.
- Attribution is an allocation methodology. It does not prove causation. Experimentation through holdouts and lift studies measures true incrementality.
- AI-mediated buyer journeys create zero-click demand and hide referrers. Instrument for citations and share of answer across AI assistants to see your real influence. See how Arjun Karnik instruments attribution for AI search.
Types Of B2B Marketing Attribution Models
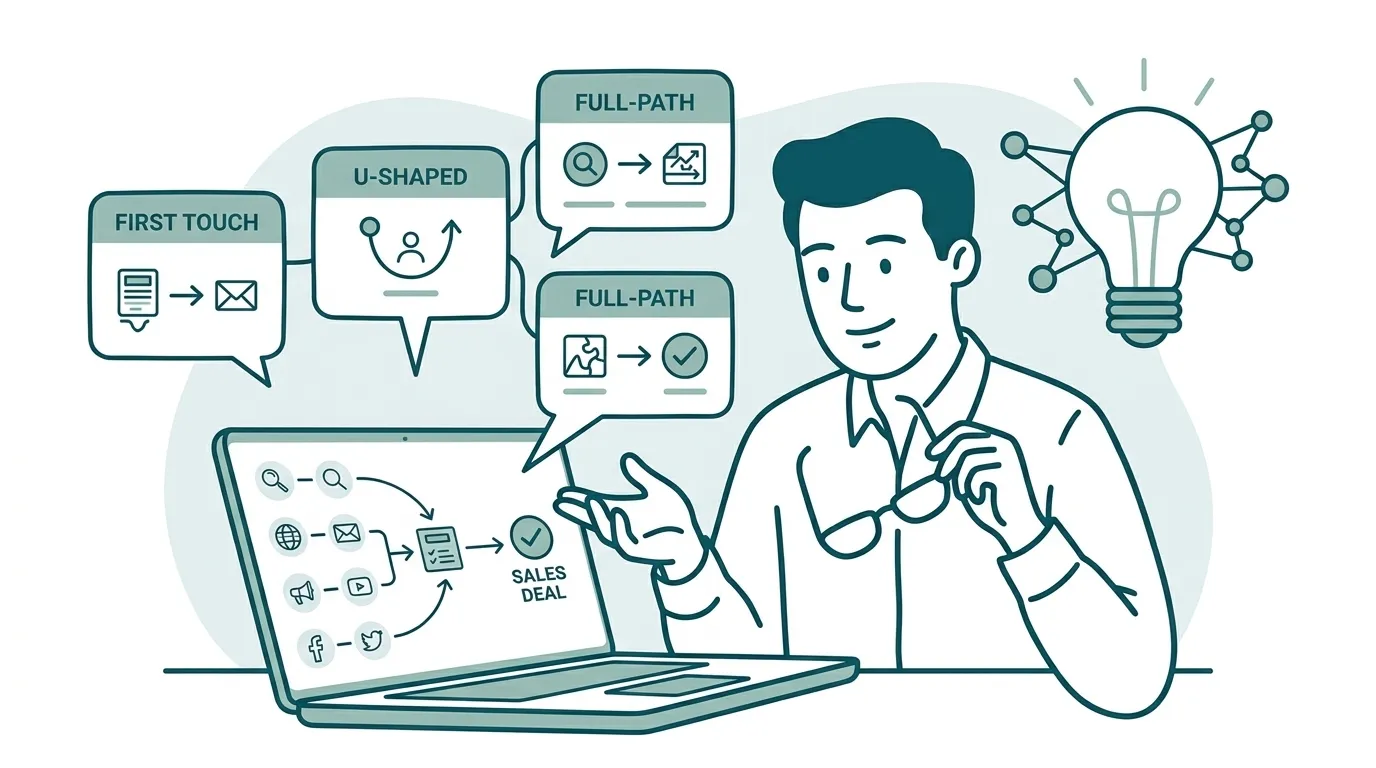
Attribution models fall into two main families. Single-touch models assign 100% of credit to one interaction. Multi-touch models distribute credit across several interactions. The table below covers all eight models, the question each answers, and where each misleads you.
| Model | How Credit Is Assigned | What Question It Answers | Where It Misleads You |
|---|---|---|---|
| First-touch | 100% to first interaction | What creates demand? | Over-credits casual early research; ignores nurture and close |
| Last-touch | 100% to final interaction | What closes deals? | Over-rewards demand-harvesting channels; defunds demand creation |
| Linear | Equal split across all touchpoints | What channels appear in successful journeys? | Treats a throwaway impression as equal to a decisive demo |
| Time-decay | Exponential weighting toward recent touches | What drives momentum near conversion? | Undervalues awareness work that started the deal |
| U-shaped | 40% first touch, 40% lead creation, 20% middle | How do we balance acquisition and conversion? | Compresses mid-funnel persuasion into 20% |
| W-shaped | 30% first touch, 30% lead creation, 30% opportunity creation, 10% middle | How do we credit pipeline milestones? | Credits marketing for outbound deals it never touched |
| Full-path | 22.5% across four milestones | How do we weight every stage gate? | Requires clean stage data most CRMs lack |
| Data-driven | Machine learning on historical conversions | What does the data say actually correlates? | Needs volume most B2B teams do not have; not inspectable |
The W-shaped 30/30/30/10 split and the full-path 22.5% across four milestones appear in general B2B marketing attribution guides, such as factors.ai, smarte.pro, and HubSpot. They do not appear in Adobe Experience League’s B2B analytics blueprint or Salesforce Campaign Influence configuration guidance. Multiple attribution guides note these splits are conventions repeated across tools, not values derived from empirical study.
Single-touch models assign all conversion credit to one interaction, either the first or the last. They stay simple but ignore the rest of the journey. Multi-touch models spread credit across several interactions. They give a fuller picture but require more data and setup. For B2B teams with defined pipeline stages and sales cycles longer than 90 days, multi-touch models such as W-shaped or time-decay are often the more defensible choice. Knowing which models exist is only half the decision. The right choice also depends on your specific pipeline conditions.
Choosing An Attribution Model For A B2B Pipeline
Attribution model selection rarely receives a clear answer in top search results. The right model depends on four concrete conditions in your business: sales cycle length, CRM, data maturity, and average deal size.
| Condition | Recommended Model | Why | Caveat |
|---|---|---|---|
| Sales cycle under 90 days | Last-touch or linear | Short cycles mean fewer touchpoints. Last-touch captures the close cleanly. | Linear still treats all touches equally. Neither reveals demand creation. |
| Sales cycle over 180 days | W-shaped or full-path with lookback window matching p90 deal cycle | Long cycles require weighting pipeline milestones, not just first and last. | Requires clean stage data. A spike in lead-created timestamps on a single date signals a backfill, not genuine demand. |
| HubSpot CRM | U-shaped, W-shaped, or full-path natively | HubSpot supports first-touch, last-touch, linear, U-shaped, W-shaped, and full-path without external logic. | Multi-touch reports still require clean contact-to-account mapping for committee deals. |
| Salesforce CRM | W-shaped or custom via Campaign Influence | Salesforce’s Primary Campaign Source field supports last-touch only; Campaign Influence enables multi-touch. | Multi-touch attribution logic must be built externally using calculated fields or custom Apex code. |
| Data maturity gaps at lead-to-opportunity transition | Fix data before running any model | W-shaped will assign the opportunity-creation milestone to whatever touch appears most recent in the data. | A model that is wrong in a way nobody can see is worse than a simpler one that is wrong in a way everybody understands. |
| Average deal size under $25K ACV | Linear or U-shaped | Lower-value deals typically have shorter cycles and fewer stakeholders. | U-shaped compresses mid-funnel persuasion into 20%. |
| Average deal size over $100K ACV | W-shaped or full-path with account-level rollup | High-value deals involve buying committees. Account-level rollup is required. | Full-path requires stage gate data most CRMs do not maintain cleanly. |
A practical sequencing approach keeps your decisions grounded. Pick a primary model for pipeline and a second for revenue. Run a neutral baseline alongside both. Compare the outputs instead of declaring one truth. Where models agree, you gain high-confidence insight. Where they diverge, you have identified areas that need deeper qualitative research. Running at least first-touch, last-touch, and one multi-touch model in parallel provides triangulation that a single model cannot.
A short diagnostic to run against your own setup shows whether your data can support these models.
- Start by pulling your p90 deal cycle from closed-won data, because this determines the lookback window for any multi-touch model.
- Next, query the lead-created field’s distribution by day. A spike on one date usually means a backfill wrote it, which will distort your model.
- Then check whether opportunities are stamped consistently. If deals jump from lead to closed-won without an opportunity timestamp, W-shaped has nothing meaningful to weight.
- Finally, confirm Campaign Influence is enabled on every opportunity in Salesforce, or your multi-touch reports will show zero revenue for campaigns.
Attributing Deals With Multiple Stakeholders
Account-level attribution treats the buying committee as the unit of analysis and assigns credit to the account’s collective touchpoints rather than to one person’s path. This closes the biggest gap on the SERP and fixes the point where every person-level model breaks.
Forrester’s State of Business Buying 2026 found the typical B2B purchase now involves 13 internal stakeholders and 9 external influencers. Gartner estimates the average B2B buying committee comprises 6 to 10 people, each with different devices, search patterns, and content preferences. The person who fills out the form is disproportionately likely to be the researcher, not the economic buyer. They arrive through the channels researchers use.
Consider a worked example. A $120K ACV software deal closes in Q3 2026. Four people from one account touched four different channels:
- VP of Marketing clicked a LinkedIn ad in January and visited the blog.
- Director of Demand Gen attended a webinar in March.
- Marketing Ops Manager submitted the demo request form in April.
- CFO attended a sales meeting in May and signed in June. The CFO never touched a marketing channel.
Under last-touch, 100% of credit goes to the demo request, the Marketing Ops Manager’s form fill. The LinkedIn ad, the blog, and the webinar receive nothing. The CFO, who signed, is invisible. Under first-touch attribution, 100% of the conversion credit goes to the first touchpoint; in Clearbit’s worked example, Gary’s conversion is attributed to the paid LinkedIn webinar program. The webinar and the demo receive nothing. Under W-shaped at the contact level, credit splits across the Marketing Ops Manager’s journey only. The VP’s LinkedIn click and the Director’s webinar attendance never enter the model.
Account-level attribution solves this gap. It rolls every touchpoint from every person at the account into a single deal timeline and distributes credit across the combined set of touches across the buying committee, including the CFO who signed but never clicked. The deal still attributes to the channels that influenced the account, even when the signing executive left no tracked footprint.
For account-based marketing, position-based attribution (W-shaped or 40-40-20) redefined at the account level is the easiest defensible starting point. First touch by anyone at the account and last touch before opportunity creation receive the position weights. This approach requires only event-log data with under 12 months of history. Markov chain models are more methodologically defensible but come at much higher cost, and enterprise B2B may warrant custom account-based models. Linear survives as a fair baseline. Last-touch and first-touch produce actively misleading results on committee-driven deals.
Running last-touch reporting against a committee-driven deal produces a specific failure mode. It credits the channel that reached the researcher and ignores every channel that reached the economic buyer, the technical evaluator, and the champion. The result is a budget recommendation that defunds the channels that actually moved the deal.
Does Attribution Prove What Caused A Deal?
Attribution is an allocation methodology. It does not prove incrementality. It distributes credit among observed touchpoints according to a rule you chose. Changing the rule produces different winners from the same customer history.
Studies show 50–80% of branded paid search conversions would have occurred without any ad exposure at all, yet attribution cannot surface this. The same blind spot applies across channels. A credit model that confidently assigns 34% to paid social has not answered the causal question. It has not even approached it.
The sourced versus influenced pipeline distinction matters more than model choice. Marketing-sourced revenue covers deals where first touch was a marketing activity; marketing-influenced revenue covers deals where marketing touched the opportunity but did not create it. Both metrics are valuable. They tell you different things about marketing’s role. Conflating them produces the number your CFO will dispute.
Attribution works at the individual journey level and refreshes quickly for tactical decisions. Experimentation through holdouts and lift studies complements attribution and measures causation. A defensible reporting system keeps three labels separate: observed contribution, estimated channel effect, and experimentally measured lift.
Why Attribution Reporting Breaks In AI-Mediated Buyer Journeys
AI-assisted research adds a new dimension to the attribution problem. B2B buyers have changed where they start their research, and the change is structural, not cyclical.
The Pew Research Center tracked the actual browsing behavior of 900 US adults across 68,879 Google searches in March 2025. When an AI summary appeared, users clicked a traditional search result in 8% of visits, against 15% when no summary appeared. Roughly half the clicks disappeared.

G2 surveyed 1,076 B2B software buyers and decision-makers across North America, EMEA, and APAC in March 2026. 71% use AI chatbots for software research. 69% chose a different vendor than the one they had planned on, based on what the assistant told them. 33% bought from a vendor they had not previously heard of. Presence in the AI answer functions as a vendor-selection event, not just a visibility metric.


The consequence for attribution is direct. Search impressions rise while clicks fall, which you can see in your reports. A second effect stays hidden. A meaningful share of AI-driven demand lands in analytics as direct or branded search because the buyer never clicked a tracked link. Data presented at Profound’s Zero Click NYC summit in June 2026 found that 80% of B2B buyers who use AI for research choose a vendor from those surfaced in the first AI session, without ever visiting the vendor’s website.

Whatever you measure is a floor, not a ceiling. The practical response is to track citations and share of answer across AI assistants instead of grading a channel on clicks it no longer produces.
What To Do First
A focused next-step checklist helps you adapt your attribution to AI-mediated journeys.
- Fix technical plumbing so the retrieval layer can read the site. Unblock AI crawlers, add schema markup, and make pages machine-parseable. Everything downstream depends on this.
- Set your lookback window to your p90 deal cycle before running any multi-touch model.
- Run a primary model for pipeline, a second for revenue, and a neutral baseline. Compare the outputs instead of declaring one truth.
- Instrument for citations and share of answer across ChatGPT, Google AI Overviews, Perplexity, and Gemini, not just clicks.
- Add a self-reported “How did you hear about us?” field to high-intent forms. Ask the same question in discovery calls and log the response in a standardized CRM field.
The window for outsized gains in AI search remains open. Early citations shape tomorrow’s record of who is credible on a topic. As answers settle, incumbents gain an advantage and the cost of entry rises. Get a walkthrough of an attribution setup built for AI-mediated journeys.