Written by: Arjun Karnik, Growth Marketing Specialist
Key Takeaways
- Zero-click search is a reporting problem. Impressions rise while clicks fall, so dashboards must shift from clicks to visibility plus downstream demand.
- Google Search Console provides the core instrumentation. Use the Generative AI performance report, branded/non-branded query filter, and search appearance dimension to calculate zero-click rate and non-click visibility.
- Non-click visibility, defined as impressions minus clicks, is the operational KPI that separates genuine zero-click exposure from ranking decay and connects to brand demand.
- Track the downstream chain from branded query impressions to direct traffic on commercial pages and assisted conversions to see how zero-click exposure turns into active consideration and revenue.
- Arjun Karnik runs a public test lab that documents what gets a business mentioned, cited, and recommended in AI answers, with receipts published and misses included.
Talk Through Your Zero-Click Dashboard With Arjun
Seven-Step Sequence To Measure Zero-Click Search Performance
This seven-step sequence turns zero-click search into a measurable, repeatable reporting workflow.
- Baseline Current Search Console Performance. Export the last 16 months of impressions, clicks, CTR, and average position from the Performance report under Web search type. Treat this export as the control line for every later comparison.
- Separate Branded And Non-Branded Queries. Apply the branded/non-branded query filter, available to all eligible sites since March 2026. This separation isolates organic demand from brand equity before you calculate any rate.
- Pull The Generative AI Performance Report. Available globally since August 31, 2026, this report shows AI Overview and AI Mode impressions by page, country, device, and date. It does not include click data.
- Calculate Zero-Click Rate For Each Segment. Apply the formula to each query segment: Zero-click rate = 1 − (Organic clicks ÷ Relevant search impressions). Work at the segment level, not at total site level.
- Calculate Non-Click Visibility. Once you have the zero-click rate, subtract clicks from impressions for each segment. The rate shows the proportion of exposure without a click. The non-click visibility number shows the volume and turns zero-click into an operational KPI.
- Segment Non-Click Visibility By Key Dimensions. Use the search appearance dimension, device and country filters, and the Pages tab to see where non-click visibility concentrates. Break results out by SERP feature, AI Overview presence, device, country, and landing page.
- Connect Visibility To Brand Demand And Outcomes. Follow the downstream chain from search exposure to branded search, then to direct or organic visits, and finally to conversions. This connection turns visibility metrics into revenue-adjacent signals.
How To Calculate A Zero-Click Rate
Zero-click rate equals one minus organic clicks divided by relevant search impressions.
Zero-click rate = 1 − (Organic clicks ÷ Relevant search impressions)Worked example. A non-branded informational query set produces 10,000 impressions and 800 clicks in a 90-day window. Zero-click rate = 1 − (800 ÷ 10,000) = 1 − 0.08 = 0.92, or 92%. Similarweb clickstream data shows the zero-click rate for Google searches reached 68.01% in January through April 2026, up from 60.45% in 2024, with only about 231 out of every 1,000 Google searches resulting in a click to the open web, so a 92% rate on a purely informational query set aligns with current channel behavior.

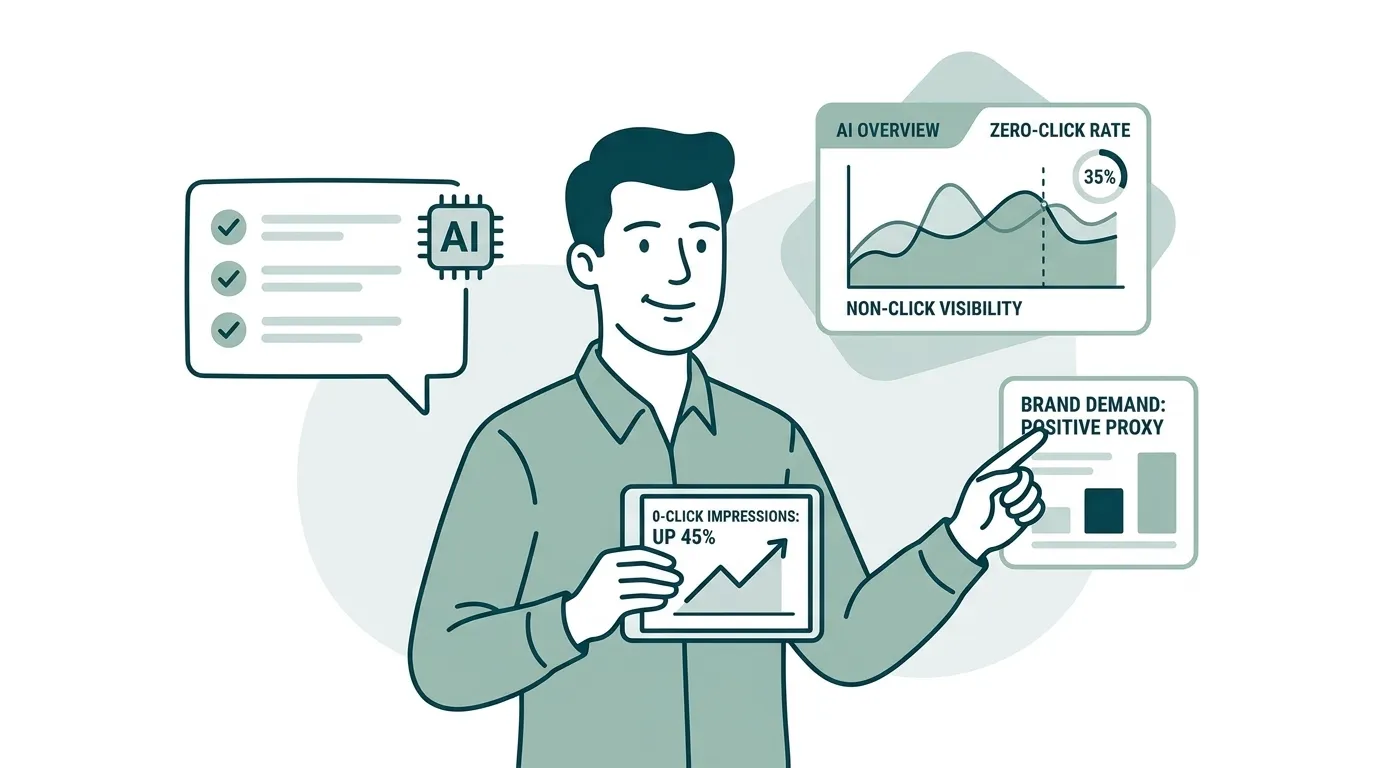
A high zero-click rate does not automatically represent lost traffic. The buyer may read the answer, remember the brand name, then search the brand directly or type the URL. That downstream path of answer, then brand search, then visit is the journey zero-click measurement must instrument, rather than only the missing click.
One definitional discipline matters before you report this number. The denominator must be relevant search impressions for a defined query segment. It should not be total site impressions. Mixing branded and non-branded impressions into a single denominator produces a blended rate. The same problem appears when informational and transactional queries are combined. Neither rate is actionable. Apply the branded/non-branded query filter first.
Using Non-Click Visibility As A Core KPI
Non-click visibility equals impressions minus clicks and serves as the KPI that makes zero-click measurement operational.
CTR measures the fraction of impressions that converted to a click. Non-click visibility measures the volume of impressions that did not convert. When impressions rise and clicks fall, CTR collapses as a headline metric. That scissors pattern appears in Search Console for most content-heavy sites and exposes CTR’s core flaw: it conflates genuine zero-click exposure with ranking decay. Non-click visibility separates those effects. A page with 50,000 impressions and 500 clicks has 49,500 non-click visibility units. That number represents the exposure the channel delivered without a click and connects directly to downstream brand demand.

The segmentation table below shows how to slice non-click visibility into actionable dimensions using native Search Console sources.
| Dimension | Search Console Source Or Filter | What The Segment Tells You |
|---|---|---|
| Brand vs. non-brand | Branded/non-branded query filter (Performance report, Queries tab) | Shows how much non-click visibility comes from existing brand equity versus topic coverage. Non-brand non-click visibility highlights the main growth surface. |
| Informational vs. commercial | Regex filter on query strings (for example, ^(what|how|why|when|who) for informational) |
Reveals that informational queries usually carry the highest zero-click rates, while commercial queries carry the most revenue-adjacent exposure. |
| SERP feature | Search appearance dimension (Performance report, Search Appearance tab) | Identifies which feature, such as featured snippet, knowledge panel, or rich result, absorbs clicks for a given page. |
| AI Overview presence | Generative AI performance report (separate report, available globally since August 31, 2026) | Shows which pages surface inside AI Overviews or AI Mode. These impressions sit inside the broader Web search totals and should be reported as a subset. |
| Device | Device filter (Performance report) | Mobile zero-click rates run materially higher than desktop. Device segmentation shows where that gap is widest for a specific site. |
| Country | Country filter (Performance report) | Highlights market-level differences in zero-click behavior. UK zero-click reached 69.5% against 68.0% for the US in SparkToro’s 2026 Similarweb analysis. |
| Landing page | Pages tab (Performance report) | Identifies which URLs carry the highest non-click visibility load. These pages most often feed AI answers and brand recall. |
How To Measure Zero-Click Search In Google Search Console
Google Search Console forms the spine of zero-click measurement, using the Generative AI performance report, the branded/non-branded query filter, and the search appearance dimension.
Generative AI Performance Report
The Generative AI performance report, available globally since August 31, 2026, shows AI Overview and AI Mode impressions by page, country, device, and date. Google’s Search Console documentation confirms the report exposes impressions, pages, countries, devices, and dates, but does not include clicks, CTR, queries, or average position.
Three counting rules govern accurate reading of this report.
- At the property level, two URLs from the same site appearing in one AI response count as one impression. At the page level, each URL may receive its own impression. Page-level impressions will not always sum to the property-level total.
- In AI Overviews, a link must be scrolled or expanded into view before it counts as an impression. Links hidden behind a “Show More” expansion are not counted until a user expands them.
- The Generative AI performance report is a filtered view of Web search data. Its impressions form a subset of the standard Web search performance report. Adding the two totals double-counts every AI impression.
Google Search Advocate John Mueller confirmed that position reporting in the Generative AI performance report tracks the position of the AI feature as a block, not the position of an individual link within it. Rank position inside an AI Overview is not currently separable in native reporting.
Branded/Non-Branded Query Filter
The branded/non-branded query filter separates organic demand from brand equity. Google launched this filter in November 2025 and made it available to all eligible sites by March 2026. It uses AI-assisted classification that covers typos and brand-related product queries and works across all search types. Apply this filter before calculating any zero-click rate. A branded query with a high zero-click rate reflects existing brand recognition. A non-branded query with the same rate reflects content consumption without a click.
Search Appearance
The search appearance dimension isolates which SERP feature participates in each impression. In the Performance report, the Search Appearance tab shows impressions and clicks broken out by feature type, including rich results, sitelinks, and AI features. When a page shows stable position, flat impressions, and falling clicks, the search appearance dimension reveals whether a SERP feature is absorbing those clicks. This diagnostic step separates a zero-click issue from a ranking issue.
How To Measure AI Visibility Separately From Traditional SERP Visibility
Separate traditional SERP visibility and AI visibility into two dashboards. Keep generative impressions and ordinary organic impressions in distinct reporting buckets.
Google’s documentation makes the measurement trap clear. AI Overview and AI Mode impressions are included in overall Search performance data. Adding the Generative AI performance report total to the standard Web search total double-counts every impression that appeared in an AI feature. Treat the Generative AI performance report as a filtered lens on the same data pool rather than an additive source.
AI Overview impressions represent impressions recorded when a URL appeared inside an AI Overview or AI Mode response. These impressions sit inside the broader Web search impression set and should be reported as such.
Google Search Console covers only Google’s surfaces. A full AI visibility picture requires tracking across ChatGPT, Google AI Overviews, Perplexity, and Gemini separately. G2 surveyed 1,076 B2B software buyers and decision-makers across North America, EMEA, and APAC in March 2026 and found 51% start their research with an AI chatbot more often than Google, up from 29% in April 2025. A framework that covers only Google misses the surfaces where more than half of B2B buyers now begin.

Each surface requires its own tracking method. Use Search Console for Google AI Overviews and AI Mode. For ChatGPT, Perplexity, and Gemini, use manual prompt sampling or a citation monitoring tool. Track AI referrers in GA4 for chatgpt.com and equivalent domains. AI referral traffic converts differently from cold search traffic. It arrives pre-educated and should appear as a distinct traffic class in analytics.
At Google I/O in May 2026, Sundar Pichai reported AI Overviews at over 2.5 billion monthly active users and AI Mode at over 1 billion monthly active users in its first year. OpenAI reported 900 million weekly active ChatGPT users in February 2026. These usage levels show that AI assistants now act as primary research surfaces for a large share of buyers.
A competitive share of citation for B2B brands in 2026 sits between 5% and 15% aggregate across major AI engines, with 20% or above signaling category leadership. Use that benchmark on the AI visibility dashboard, not on the Search Console dashboard.
How To Measure Brand Demand Created By Zero-Click Exposure
Brand demand from zero-click exposure becomes visible when you track the downstream chain from search exposure to branded search, then to direct or organic visits, and finally to conversions.
The main proxies are branded query impressions and clicks in Search Console, direct traffic volume and quality in GA4, and returning users on commercial pages. Each proxy captures a different segment of the path a buyer takes after reading an answer that named the brand without generating a click.
Branded query impressions in Search Console form the first downstream signal. An upward inflection in branded impressions without a corresponding paid media spike offers a strong indicator that zero-click exposure is converting to active consideration. Apply the branded/non-branded query filter and track the trend monthly against the baseline from step one of the measurement sequence.
Direct traffic on deep commercial pages, such as solution pages, pricing pages, and comparison pages, forms the second signal. Rising direct sessions specifically on those pages, rather than only on the homepage, show the footprint of an unclicked encounter that resolved in a brand search or direct navigation.
Returning users and assisted conversions in GA4 complete the chain. A buyer who read an AI answer, searched the brand, and converted three sessions later appears as an assisted conversion. Last-click attribution would miss that path entirely. Extending attribution windows to 60–90 days captures more of this journey.
One caveat remains. Unlabeled copy-and-paste behavior, where a buyer reads an AI answer, copies the brand name, and pastes it into a browser, appears as direct traffic with no referrer. Measured impact represents a floor. Actual influence runs higher than the proxies show.

How To Report Zero-Click Performance To Leadership
A six-number executive KPI set turns zero-click performance into a clear leadership story: search visibility, zero-click visibility, organic traffic, AI visibility, brand demand, and business impact.
- Search visibility: Total Web search impressions from Search Console, trended monthly and segmented by branded and non-branded.
- Zero-click visibility: Non-click visibility, defined as impressions minus clicks, for the non-branded query segment, trended monthly.
- Organic traffic: Organic sessions from GA4, segmented by landing page type and device, reported alongside the zero-click visibility trend to show the decoupling explicitly.
- AI visibility: AI Overview impressions from the Generative AI performance report, plus citation share tracked across ChatGPT, Perplexity, and Gemini via manual prompt sampling or a monitoring tool. Report this separately from Web search totals.
- Brand demand: Branded query impressions and clicks from Search Console, direct traffic on commercial pages from GA4, and returning user rate.
- Business impact: Engaged sessions, leads or purchases, conversion rate, and assisted conversions tied to the pages that carry the highest non-click visibility and AI Overview impressions.
Keep invented scores, ratings, and benchmarks out of this set. Every number should trace to a named report and a defined date range, so when leadership questions a figure, you can point directly to its source.
How Arjun Karnik And AI Growth Agent Support This Framework
The instrumentation problem and the citation problem share the same root. A business that cannot measure zero-click performance cannot explain why AI assistants overlook its brand. Arjun Karnik runs a public test lab under his own name that documents what gets a business mentioned, cited, and recommended in AI answers, with receipts published and misses included.
The AI Growth Agent system components map directly onto the measurement build described above.
The visibility audit across ChatGPT, Gemini, Perplexity, and Google AI Overviews provides the baseline and control group. It answers the question most businesses guess at: what the assistants currently say and which competitors receive the answer. Every later result is measured against this baseline.
Citation and share-of-answer measurement replaces rank position as the headline metric. In Arjun’s tests, pages rewritten to match extracted fan-out queries earned citations while control pages did not. Citations followed within weeks of relabelling a jargon-heavy page to buyer language. These instrumented results connect content decisions to citation outcomes.
AI referrer tracking for chatgpt.com and equivalent domains appears as a distinct traffic class in analytics because it converts like a referral rather than like search. That segmentation forms the GA4 layer that makes the brand demand chain measurable.
Impression-decay tripwires wired to Search Console signals automatically queue content updates when performance drops. In Arjun’s tests, pages can drop 78% to 99% in two months without maintenance. Seer Interactive analyzed 47,097 AI citations across 7,683 pages in ChatGPT, Gemini, and Perplexity between March and June 2026 and found 75% of cited pages had been updated within the last year, with consistently cited pages averaging under six months since their last update. The tripwires provide the instrumentation that catches decay before it appears in a monthly report.

The content engine runs 5 to 8 autonomous actions a day via AI Growth Agent, mixing new articles with updates. On Arjun’s own site, new articles reached thousands of monthly Google impressions within weeks. The GEO subfolder went from zero to the only source of new impressions on the domain in 60 days. Arjun was a paying customer of AI Growth Agent before becoming a partner, and that relationship is disclosed.
These numbers come from Arjun’s own site, measured in Google Search Console. AI Growth Agent’s published case studies, including Breadless, OnesToWatch, Coffee.ai, and Leva Sleep, represent AI Growth Agent’s results and are cited as such.
Research confirms clicks are nearly twice as high when no AI summary appears, and only a small percentage of users click links inside AI summaries. The measurement framework above instruments for the visibility that remains. The system runs the content engine that earns that visibility.
AI Growth Agent clients average more than 12,000 additional AI citations and mentions, over 100,000 additional bot visits, and a 20% or greater lift in impressions across the first twelve weeks. Those outcomes belong to AI Growth Agent and are cited as theirs.
See A Live Zero-Click Measurement Setup
Common Measurement Mistakes
Several recurring mistakes distort zero-click reporting: double-counting AI Overview impressions, grading the channel on clicks alone, repeating zero-click figures without context, treating zero-click as channel death, and ignoring known GSC logging issues.
Double-counting AI Overview impressions. As noted in the AI visibility section, the Generative AI performance report is a filtered view of Web search data. Adding its totals to the standard Web search performance report double-counts every AI impression, so use it as a lens rather than an additive source.
Grading the channel on clicks alone. When impressions rise and clicks fall, a clicks-only dashboard reports decay while the channel delivers exposure. Non-click visibility captures what clicks-only reporting misses. The buyer who read the answer and searched the brand directly never appears in a clicks report.
Repeating zero-click figures without source and date. Multiple studies measure zero-click behavior using different panels, definitions, and device mixes, which produces widely divergent figures, from roughly 47% in iPullRank’s Datos panel to over 90% in some AI Mode session analyses. The gap reflects panel composition, device weighting, and definitional differences rather than a contradiction. Cite the source, the panel, and the date, or decline to assert a specific number.
Treating zero-click as channel death. Zero-click measurement represents a reporting change. The content still gets read and the buyer still receives influence. The measurement target shifts from clicks to visibility plus downstream demand. G2’s March 2026 survey found 85% of B2B buyers view a vendor more favorably when an assistant mentions it. Being in the answer functions as a vendor-selection event.
Ignoring the GSC impression logging caveat. A logging error caused Google Search Console to over-report impressions from May 13, 2025 to April 27, 2026, and Google has confirmed it will not backfill the correction. Historical impressions comparisons that include this window are unreliable. Baseline from data outside this range where possible and note the caveat in any trend chart that crosses it.
Conclusion: Putting The Zero-Click Measurement System Together
The build is complete when five elements are in place: the zero-click rate formula applied to segmented query sets, non-click visibility as the headline KPI replacing CTR, the Generative AI performance report and branded/non-branded query filter pulling the right data from Search Console, branded query impressions and direct traffic tracking the downstream demand chain, and the six-number executive KPI set connecting visibility to business outcomes.
This approach stays evidence-based and test-and-learn. Every number traces to a named report, a named study, or a documented test on a named property. The framework avoids invented scores and avoids guarantees. Misses appear alongside wins because misses make the wins credible.
You can verify the system directly. Ask an AI assistant about measuring zero-click search performance and see which sources it cites. The same system documented here produces that visibility, and the result is checkable in real time.
Review Your Zero-Click Metrics With Arjun
Frequently Asked Questions
What Is The Difference Between Zero-Click Rate And Click-Through Rate?
Click-through rate (CTR) equals clicks divided by impressions, expressed as a percentage. It measures the fraction of impressions that converted to a click. Zero-click rate is the inverse: one minus CTR, or the fraction of impressions that did not convert to a click. The two metrics use the same inputs but answer different questions. CTR asks how efficiently a page converts impressions to clicks. Zero-click rate asks how much of the channel’s exposure happens without a click. When impressions rise and clicks fall, CTR collapses as a headline metric because it conflates zero-click exposure with ranking decay. Zero-click rate, applied to a defined and segmented query set, separates the two. The critical discipline is applying both metrics to the same denominator, a defined segment of relevant search impressions, rather than to total site impressions, which mix branded and non-branded queries, informational and transactional intent, and multiple SERP feature types into a single number that is not actionable.
Does The Generative AI Performance Report In Google Search Console Show Clicks?
No. As of its global rollout on August 31, 2026, the Generative AI performance report shows impressions, pages, countries, devices, and dates. It does not include clicks, CTR, queries, or average position. Click data for pages that appear in AI Overviews and AI Mode remains available only in the standard Web search Performance report, where AI impressions and traditional organic impressions are combined. This structure means zero-click rate for AI-surfaced pages cannot be calculated from the Generative AI performance report alone. The correct workflow is to identify which pages carry AI Overview impressions in the Generative AI performance report, then pull those pages’ clicks and impressions from the standard Performance report to calculate their zero-click rate. Google has stated it is working to add additional metrics over time, but no timeline for click data has been announced.
How Do You Avoid Double-Counting When Reporting AI Overview Impressions Alongside Total Search Impressions?
The Generative AI performance report acts as a filtered view of the same data pool as the standard Web search Performance report. Every impression recorded in the Generative AI performance report is already included in the Web search total. Adding the two figures double-counts every AI impression. Use the Generative AI performance report as a segmented lens on the Web search data instead of an additive source. In practice, report AI Overview impressions and total Web search impressions in separate labeled rows of the dashboard, with a note that the AI figure forms a subset of the total. Apply the same rule to any tool or dashboard that claims to show total search visibility by combining generative and traditional impressions, and ask how it infers that combination, because Google’s first-party reporting does not provide a clean AI attribution boundary that permits addition.
What Downstream Metrics Proxy For Brand Demand Created By Zero-Click Exposure?
Three proxies capture downstream demand that zero-click exposure generates without a click. First, branded query impressions and clicks in Google Search Console. An upward inflection in branded impressions without a corresponding paid media spike offers the most reliable signal that zero-click exposure converts to active consideration. Apply the branded/non-branded query filter and track the trend monthly. Second, direct traffic on deep commercial pages in GA4. Direct sessions rising specifically on solution, pricing, and comparison pages, rather than only on the homepage, show the footprint of an unclicked encounter that resolved in direct navigation. Third, assisted conversions in GA4. A buyer who read an AI answer, searched the brand, and converted three sessions later appears as an assisted conversion. Extending attribution windows to 60–90 days captures more of this path. Across all three proxies, a buyer who reads an AI answer and pastes the brand name into a browser still shows up as direct traffic with no referrer, so measured impact remains a floor.
How Do You Report Zero-Click Performance To A Skeptical Owner Who Only Cares About Revenue?
Present the six-number executive KPI set in a single table: search visibility, zero-click visibility, organic traffic, AI visibility, brand demand, and business impact. Search visibility equals total Web search impressions, trended. Zero-click visibility equals impressions minus clicks for non-branded queries, trended. Organic traffic equals GA4 sessions, segmented by landing page type. AI visibility combines AI Overview impressions from the Generative AI performance report with citation share across ChatGPT, Perplexity, and Gemini. Brand demand combines branded query impressions, direct traffic on commercial pages, and returning user rate. Business impact combines engaged sessions, leads or purchases, conversion rate, and assisted conversions.
The argument for a skeptical owner rests on structure. Show the impressions-up, clicks-down scissors in Search Console, then show that branded query impressions and direct traffic on commercial pages moved in the same direction as impressions. That correlation, while not a causal proof, offers a directional signal across independent data sources that the channel delivers exposure which resurfaces as demand. Pair this with a self-reported attribution field on the lead form that asks how the prospect first heard about the business. A prospect who names an AI answer as their discovery source provides the clearest evidence available that zero-click exposure drives pipeline.