Written by: Arjun Karnik, Growth Marketing Specialist
Key Takeaways
- AI summaries cut click-through rates in half, so traditional ranking and session metrics no longer capture true performance.
- Record four operational baselines before scaling AI content: time-to-publish, cost-per-piece, editorial revision rate, and organic conversion rate.
- Organize KPIs into four layers (Efficiency, Quality, AI Visibility, Business Outcome) and keep only metrics that change a decision.
- Treat reported AI-driven demand as a floor, and track citations and share of answer alongside direct and branded traffic.
- Book a demo to see how Arjun Karnik measures AI content performance in practice and learn the metrics most dashboards still miss.

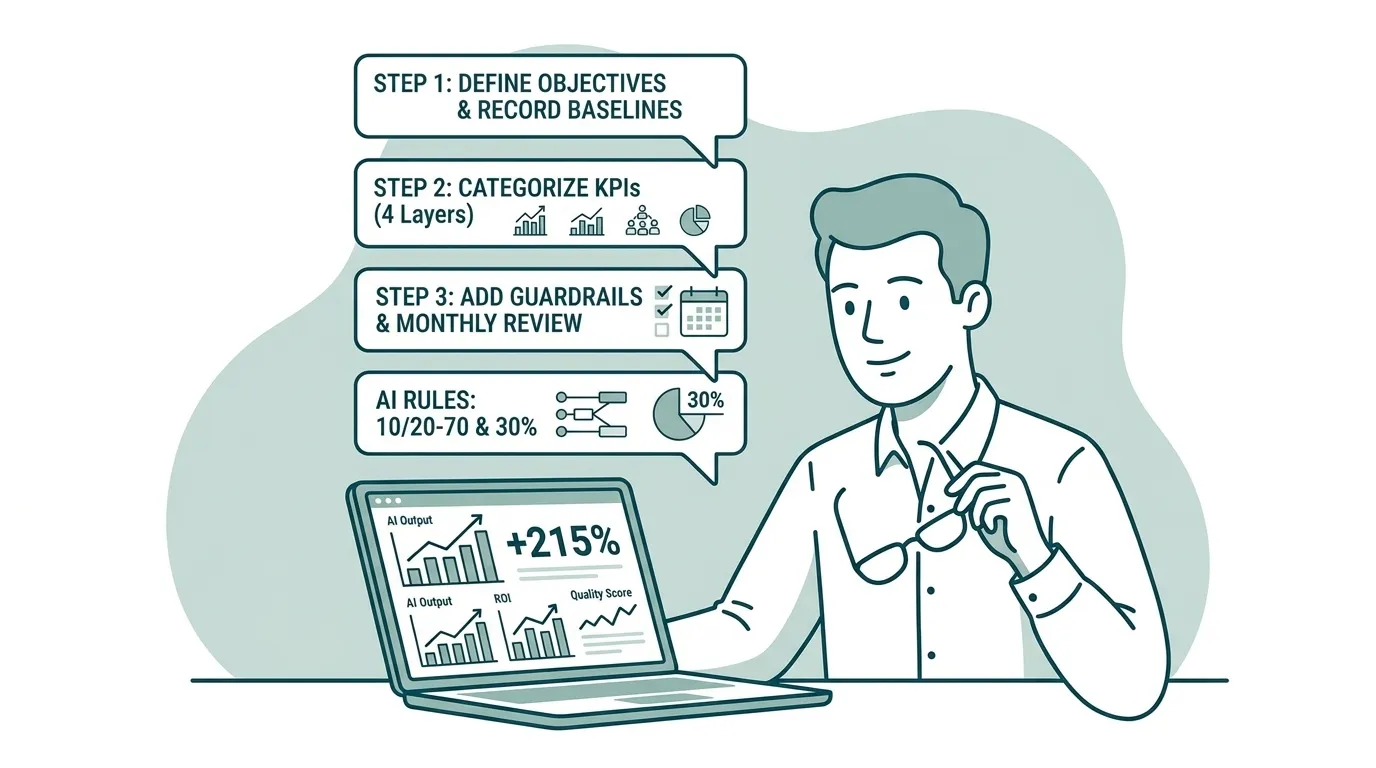
How To Set KPIs For AI Content Strategy: The Three Steps
- Step 1: Define Objectives And Record Baselines – a target without a baseline is a guess.
- Step 2: Categorize Your KPIs Into Four Layers – four layers, two to three metrics each, and every metric must change a decision.
- Step 3: Add Guardrails And Review Monthly – guardrails are the thresholds that tell you when a KPI has stopped being useful.
Step 1: Define Objectives and Record Baselines
A target without a baseline is a guess. Before scaling AI content, record the current state of four operational metrics on a fixed date.
- Time-to-publish – days from brief to live URL.
- Cost-per-piece – fully loaded cost including tools, labor, and review time.
- Editorial revision rate – the percentage of first drafts requiring significant rewriting, defined as restructuring sections or rewriting entire paragraphs, not light copy edits.
- Organic conversion rate – conversions from organic landing pages divided by organic sessions.
These four numbers become the control group. Every result after scaling is measured against them. The Starr Conspiracy’s Q2 2024 B2B AI Marketing Report found a median time-to-publish of 4.7 days for AI-augmented teams and a median fully loaded cost per long-form asset of $847. Those benchmarks are useful reference points. Your baseline, however, is what your operation produces today, recorded before you change anything.
Tools can help with the first half of this step. A free AI KPI generator is a reasonable starting point for identifying which metrics to track. But no generator can record your baseline for you. That number only exists if you capture it before you scale.
See the KPI framework applied to a live dashboard.
Step 2: Categorize Your KPIs Into Four Layers
Keep the KPI list tight and intentional. Four layers with two to three metrics each give enough coverage without turning the dashboard into a report nobody reads.
Apply a simple selection filter to every candidate metric. Ask what decision this metric will change. If the answer is “none,” remove it from the dashboard.
Layer 1 – Efficiency
- Time-to-publish
- Cost-per-piece
- Editorial revision rate
Teams without a brief system typically run revision rates of 50% to 70%, while teams using AI-generated briefs drop to 20% to 30%. A revision rate above 40% signals a brief problem that slows writers and editors.
Layer 2 – Quality
- Factual accuracy rate – the percentage of published pieces that pass a post-publication fact check without correction.
- Revision rate – tracked separately from efficiency because it measures output quality, not production speed.
- Answer-first structure compliance – the percentage of published pieces where the primary question is answered in the first paragraph.
Adding statistics increases AI citation visibility by around 31–33% and adding quotations by around 41–43%, according to the Princeton GEO study. Answer-first structure and cited specifics act as quality signals for both human readers and AI retrieval.
Layer 3 – AI Visibility
- Citation frequency – raw count of citations earned across AI surfaces in a fixed period.
- AI referral traffic – sessions arriving from chatgpt.com, perplexity.ai, gemini.google.com, and claude.ai, segmented as a distinct channel group in GA4.
- Share of answer – the proportion of tracked prompts where the brand appears in the AI-generated response.
Track each surface separately: ChatGPT, Google AI Overviews, Perplexity, and Gemini. A competitive share of citation for B2B brands in 2026 sits between 5% and 15% aggregate across major AI engines, with 20% or above signaling category leadership. Treating AI visibility as a single citation count collapses signal that differs by surface. Perplexity, ChatGPT, and Gemini cite different domains for the same queries. A brand can hold 20% share of answer on Perplexity and 5% on Gemini in the same week.
The Semrush AI Visibility Study found that AI citations change 40 to 60% month over month. A single measurement is noise, while a trend line is signal. Run each tracked prompt three to five times per surface per measurement cycle and report a consistency rate alongside the point estimate.
Layer 4 – Business Outcome
- Organic conversion rate
- Pipeline influenced – opportunities that touched at least one piece of AI-assisted content in the buyer journey.
- Branded search volume – monthly impressions for brand-name queries in Google Search Console.
G2 surveyed 1,076 B2B software buyers across North America, EMEA, and APAC in March 2026 and found that 69% chose a different vendor than planned based on what an AI assistant told them, and 33% bought from a vendor they had not previously heard of. Being cited in an AI answer is a vendor-selection event. Branded search volume captures the downstream signal from buyers who read an AI answer, remembered a name, and typed it into a browser.

Filled-In KPI Template Table
| Metric | Layer | Baseline | Target |
|---|---|---|---|
| Time-to-publish | Efficiency | 6 days | 3 days in 90 days – Content lead |
| Cost-per-piece | Efficiency | $850 | $400 in 90 days – Content lead |
| Editorial revision rate | Quality | 55% | Under 30% in 60 days – Editor |
| Citation frequency (ChatGPT) | AI Visibility | 2/month | 10/month in 90 days – SEO lead |
| Share of answer | AI Visibility | 4% | 12% in 90 days – SEO lead |
| Organic conversion rate | Business Outcome | 1.2% | 2.5% in 180 days – Marketing lead |
The template above is only as useful as the baseline numbers you feed it. Capture those baselines before you change the system, then update the table as the operation matures.
Step 3: Add Guardrails and Review Monthly
Guardrails keep the KPI list honest. They define when a metric still earns its place on the dashboard and when it should be retired.
Set three guardrails for each KPI at the time you add it to the dashboard.
- Review cadence – monthly for operations metrics, quarterly for executive metrics.
- Owner – one named person per metric. A metric with no owner has no accountability.
- Revision trigger – the condition under which the metric is replaced or retired. If citation frequency has held flat for two consecutive quarters despite structural changes, replace it with share of answer or a surface-specific variant.
State the attribution limitation plainly. AI-driven demand frequently arrives as direct or branded traffic because buyers copy an answer and paste a brand name into a browser. GA4 misclassifies 15–35% of AI-driven traffic as direct because AI platforms like ChatGPT, Perplexity, and Claude do not pass referrer headers consistently. Whatever the dashboard reports is a floor. Instrument for citations and share of answer instead of grading a channel on clicks it no longer produces.

Freshness is the guardrail that matters most. In Arjun’s own tests, pages that went unmaintained for two months lost 78% to 99% of their visibility. Seer Interactive analyzed 47,097 AI citations across 7,683 pages in ChatGPT, Gemini, and Perplexity between March and June 2026 and found that 75% of cited pages had been updated within the last year, with consistently cited pages averaging under six months since their last update. Treat freshness as a core part of the program and build a monthly review into the calendar before decay shows up in the report.

Walk through the test lab’s measurement setup.
Two Rules That Shape How You Allocate KPI Effort
Before you finalize the dashboard, two widely cited rules explain why measurement and process work matter more than tool choice.
What Is The 10/20-70 Rule For AI?
Boston Consulting Group developed the 10/20-70 rule based on research into hundreds of AI transformations. The rule allocates roughly 10% of effort to algorithms and models, 20% to data and technology infrastructure, and 70% to people, processes, and organizational change. BCG’s research found that organizations treating AI as a human and process problem succeed more often than those treating it purely as a technology problem. Applied to an AI content strategy, the rule means that picking the right KPIs and building the measurement workflow deliver more return than the choice of AI tool.
What Is The 30% Rule In AI?
The 30% rule is a rule of thumb for dividing labor between AI and people: let AI handle roughly the routine, predictable share of a workflow, often described as about 30%, while people retain judgment, oversight, and high-context decisions. It is a heuristic rather than a measurement. The rule has no single authoritative origin and circulates in slightly different forms across consultants, educators, and vendors. In a content operations context, the 30% rule is a starting ratio for deciding which production steps to automate and which to keep under human review.
What KPIs Should You Not Track for AI Content?
Knowing which metrics to include is only half of the filter. The other half is knowing which ones to keep off the dashboard entirely, especially metrics that measure activity rather than results.
Content volume does not qualify as a KPI. Every competing metric list leads with volume and velocity. Both are inputs and neither answers the question a founder is asking.
Remove these from the leadership dashboard.
- Content volume as a headline metric – the number of articles published per month does not tell you whether any of them earned a citation, drove a conversion, or influenced pipeline.
- Raw AI output counts – the number of AI-generated drafts produced is a production metric. It measures activity rather than performance.
- Any metric without an owner – a metric with no named owner has no accountability and no revision trigger. It accumulates on dashboards and crowds out the metrics that do change decisions.
A 40-KPI report is effectively a 0-KPI report because nobody reads it. Report 7 to 9 KPIs to leadership, one per funnel stage plus two revenue KPIs, and track the rest as supporting diagnostic metrics that inform but do not appear in the executive view.
The Dashboard Spec: Four Views
With the metric list trimmed, the remaining question is who reads what. The four layers map onto four dashboard views, each owned by a different role and answering a different question.
- Executive view – Share of answer, pipeline influenced, branded search volume. Read by the founder. Answers whether the brand appears in AI answers and whether that presence moves pipeline.
- Operations view – Time-to-publish, cost-per-piece, editorial revision rate. Read by the content lead. Answers whether the production system works and whether it is getting more efficient.
- Quality view – Factual accuracy rate, revision rate, answer-first structure compliance. Read by the editor. Answers whether the output meets the standard required for AI citation.
- Performance view – Citation frequency by surface (ChatGPT, Google AI Overviews, Perplexity, Gemini), AI referral traffic, organic conversion rate. Read by the marketing lead. Answers which surfaces cite the brand and whether that traffic converts.
The table below shows why single-metric approaches fail. Each one captures a slice of performance and misses the rest. The four-layer framework is included for contrast, since its constraint is that it requires baselining before scaling rather than a specific failure mode.
| KPI Approach | What It Measures | Where It Breaks |
|---|---|---|
| Rankings only | Position on a human-readable list | Does not capture citation in AI answers |
| Sessions only | Traffic volume | Misses zero-click demand and AI referral |
| Citation count only | Raw mentions across surfaces | Treats AI visibility as a single number |
| Four-layer framework | Efficiency, quality, AI visibility, business outcome | Requires baselining before scaling |
AI Growth Agent clients average more than 12,000 additional AI citations and mentions, over 100,000 additional bot visits, and a 20% or greater lift in impressions across the first twelve weeks. Those are AI Growth Agent’s results, attributed to AI Growth Agent. On Arjun’s own site, the GEO subfolder went from zero to the only source of new impressions on the domain in 60 days, with new articles reaching thousands of monthly Google impressions within weeks, measured in his own Google Search Console. The system running on his site operates via AI Growth Agent, which he uses and discloses as a partner, at 5 to 8 autonomous actions per day combining new articles with updates.
Conclusion: Test, Learn, Report the Floor
The dashboard built from this framework gives you a practical starting point. Baselines shift as the operation matures, and guardrails need updating as the channel changes. The attribution floor, the share of AI-driven demand that arrives as direct or branded traffic and never gets credited, means the numbers reported stay conservative. Report them as a floor and build the measurement system to get more accurate over time rather than to look complete on day one.
Arjun Karnik is a twenty-year tech marketer and former B2B software CMO who runs a public test lab for generative engine optimization under his own name, documenting exactly what gets a business mentioned, cited, and recommended in AI answers and publishing the receipts, misses included. The method is self-verifying: ask an AI assistant about these topics and see who gets cited.
Frequently Asked Questions
This FAQ extends the three-step framework with practical details on scope, baselining, and review cadence.
How Many KPIs Should an AI Content Strategy Have?
Report 7 to 9 KPIs to leadership, one per funnel stage plus two revenue KPIs. Track another 10 to 20 as supporting diagnostic metrics that inform decisions but do not appear in the executive view. The four-layer framework produces six headline KPIs: two efficiency metrics, one quality metric, two AI visibility metrics, and one business outcome metric. That set works well for a founder review. Adding more metrics adds noise and reduces the chance that anyone acts on any of them. The selection filter stays the same: if a metric does not change a decision, it does not belong on the dashboard.
How Do You Baseline AI Content Performance Before You Have Any Data?
Record the four operational baselines covered in Step 1 on a fixed date before scaling. For AI visibility, run 20 to 50 buyer-intent prompts across ChatGPT, Google AI Overviews, Perplexity, and Gemini and record whether the brand appears in each answer. That prompt run becomes the AI visibility baseline. Do it once before any structural changes, and repeat it on the same prompt set at the same cadence after changes. The gap between the two measurements is the signal. Teams that skip baselining have no way to separate the effect of their AI content investment from background market movement.
Why Is AI Referral Traffic an Unreliable Measure of AI Content Performance?
As noted in Step 3, AI platforms do not pass referrer headers consistently, so GA4 undercounts AI-driven traffic. Buyers often read an AI answer, copy a brand name, and type it into a browser, which produces a branded search or direct visit with no visible AI source. Google AI Overviews and AI Mode send traffic with a google.com referrer, so those sessions appear as organic search in GA4 rather than as a distinct AI channel. The practical consequence is that AI referral traffic should serve as a supporting signal rather than a primary metric. Track citation frequency and share of answer as the main AI visibility metrics and explain the attribution limitation clearly to any founder or executive reviewing the numbers.
What Is the Difference Between Citation Frequency and Share of Answer?
Citation frequency is the raw count of times an AI engine links to or attributes a domain as a source across a set of responses. Share of answer is the proportion of tracked prompts where the brand appears in the AI-generated response at all, whether linked or not. Citation frequency measures depth, or how often the engine treats the site as source material. Share of answer measures breadth, or how often the brand is part of the answer the buyer receives. Both metrics matter. A brand with high citation frequency on a narrow set of prompts and low share of answer across the full buyer question space has a coverage gap. A brand with high share of answer but low citation frequency is being mentioned without being treated as a citable source, which points to an infrastructure or content structure problem. Track both, segment by surface, and report them on the same timeline as branded search volume and AI referral traffic.
How Often Should AI Content KPIs Be Reviewed and Updated?
Operations metrics such as time-to-publish, cost-per-piece, editorial revision rate, and citation frequency should be reviewed monthly. Executive metrics such as share of answer, pipeline influenced, and branded search volume should be reviewed quarterly. The prompt set used to measure AI visibility should be recalibrated quarterly to reflect changes in buyer language, new product areas, and emerging competitor positioning. Any metric that has not changed a decision in two consecutive review cycles should be retired or replaced. The KPI list itself evolves as AI citation behavior shifts, attribution tooling improves, and the business questions change. Build a quarterly KPI audit into the calendar alongside the quarterly executive review.